Financial Results
Non-IFRS Financial Measures
In Millions of U.S. Dollars (Unaudited)Revenues from Ongoing Businesses
2012
2013
Adjusted EBITDA
2012
2013
Adjusted EBITDA Margin %
2012
2013
Adjusted EBITDA Less Capital Expenditures
2012
2013
Adjusted EBITDA Less Capital Expenditures Margin %
2012
2013
Underlying Operating Profit
2012
2013
Underlying Operating Profit Margin %
2012
2013
Adjusted Earnings Per Share
2012
2013
Financial Results
Cash Flow
In Millions of U.S. Dollars (Unaudited)2012
Free cash flow from ongoing businesses
Free cash flow
2013
Free cash flow from ongoing businesses
Free cash flow
Financial Results
Revenue Profile
Revenues by media, region and type (ongoing businesses)Year ended 2013
Revenues by media

Revenues by region

Revenues by type

Financial Results
Business Segment Revenue
In Millions of U.S. Dollars (Unaudited)| Twelve Months Ended December 31, | ||||
| Revenues | 2013 | 2012 (1) | Change | Organic |
| Trading | $2,480 | $2,645 | -6% | -6% |
| Investors | 2,142 | 2,168 | -1% | -1% |
| Marketplaces | 1,779 | 1,770 | 1% | -3% |
| Governance, Risk & Compliance | 247 | 219 | 13% | 10% |
| Financial & Risk | 6,648 | 6,802 | -2% | -3% |
| Legal | 3,351 | 3,266 | 3% | -1% |
| Tax & Accounting | 1,243 | 1,161 | 7% | 5% |
| Intellectual Property & Science | 982 | 894 | 10% | 4% |
| Corporate & Other (includes Media) | 331 | 331 | 0% | 2% |
| Eliminations | (12) | (11) | ||
| Revenues from Ongoing Businesses (2) Before Currency |
12,543 | 12,443 | 1% 2% |
-1% |
| Other Businesses (3) | 159 | 689 | ||
| Revenues | $12,702 | $13,132 | -3% | |
Financial Results
Business Segment Adjusted EBITDA (4)
In Millions of U.S. Dollars (Unaudited)| Twelve Months Ended December 31, | ||||
| Adjusted EBITDA | 2013 | 2012 (1) | Change | |
| Financial & Risk | $1,457 | $1,691 | -14% | |
| Legal | 1,194 | 1,246 | -4% | |
| Tax & Accounting | 378 | 352 | 7% | |
| Intellectual Property & Science | 304 | 303 | 0% | |
| Corporate & Other (includes Media) | (263) | (282) | ||
| Adjusted EBITDA | $3,070 | $3,310 | -7% | |
Financial Results
Business Segment Underlying Operating Profit (5)
In Millions of U.S. Dollars (Unaudited)| Twelve Months Ended December 31, | ||||
| Underlying Operating Profit | 2013 | 2012 (1) | Change | |
| Financial & Risk | $816 | $1,082 | -25% | |
| Legal | 903 | 967 | -7% | |
| Tax & Accounting | 257 | 238 | 8% | |
| Intellectual Property & Science | 225 | 235 | -4% | |
| Corporate & Other (includes Media) | (320) | (317) | ||
| Underlying Operating Profit | $1,881 | $2,205 | -15% | |
Financial Results
Business Segment Adjusted EBITDA (4) and Adjusted EBITDA less Capital Expenditures
In Millions of U.S. Dollars (Unaudited)| Twelve Months Ended December 31, | ||||
| Adjusted EBITDA | 2013 | 2012 (1) | Change | |
| Financial & Risk | $1,457 | $1,691 | -14% | |
| Legal | 1,194 | 1,246 | -4% | |
| Tax & Accounting | 378 | 352 | 7% | |
| Intellectual Property & Science | 304 | 303 | 0% | |
| Corporate & Other (includes Media) | (263) | (282) | ||
| Adjusted EBITDA | 3,070 | 3,310 | -7% | |
| Capital Expenditures less proceeds from disposals (excluding Other Businesses) | 1,003 | 946 | 6% | |
| Adjusted EBITDA less Capital Expenditures (4) | $2,067 | $2,364 | -13% | |
Financial Results
Consolidated Income Statement
In Millions of U.S. Dollars, except per share amounts| Twelve Months Ended December 31, | |||
| 2013 | 2012 | ||
| Revenues | $12,702 | $13,132 | |
| Operating Expenses | (9,554) | (9,710) | |
| Depreciation | (416) | (425) | |
| Amortization of Computer Software | (773) | (691) | |
| Amortization of Other Identifiable Intangible Assets | (641) | (619) | |
| Other Operating Gains, Net | 198 | 883 | |
| Operating Profit | 1,516 | 2,570 | |
| Finance Costs, Net: | |||
| Net Interest Expense | (460) | (453) | |
| Other Finance Income (Costs) | (53) | 40 | |
| Income Before Tax and Equity Method Investees | 1,003 | 2,157 | |
| Share of Post-Tax Earnings and Impairment in Equity Method Investees | 20 | 9 | |
| Tax Expense | (848) | (126) | |
| Earnings from Continuing Operations | 175 | 2,040 | |
| Earnings from Discontinued Operations, Net of Tax | 10 | 2 | |
| Net Earnings | $185 | $2,042 | |
| Earnings Attributable to: | |||
| Common Shareholders | 137 | 1,989 | |
| Non-Controlling Interests | 48 | 53 | |
| Earnings Per Share | |||
| Basic Earnings Per Share: | |||
| From Continuing Operations | $0.15 | $2.40 | |
| From Discontinued Operations | 0.01 | - | |
| Basic Earnings Per Share | $0.16 | $2.40 | |
| Diluted Earnings Per Share: | |||
| From Continuing Operations | $0.15 | $2.39 | |
| From Discontinued Operations | 0.01 | - | |
| Diluted Earnings Per Share | $0.16 | $2.39 |
Financial Results
Consolidated Statement of Financial Position
In Millions of U.S. Dollars| Twelve Months Ended December 31, | |||
| Assets | 2013 | 2012 | |
| Cash and Cash Equivalents | $1,316 | $1,283 | |
| Trade and Other Receivables | 1,751 | 1,818 | |
| Other Financial Assets | 183 | 72 | |
| Prepaid Expenses and Other Current Assets | 650 | 638 | |
| Current Assets Excluding Assets Held for Sale | 3,900 | 3,811 | |
| Assets Held for Sale | - | 302 | |
| Current Assets | 3,900 | 4,113 | |
| Computer Hardware and Other Property, Net | 1,291 | 1,416 | |
| Computer Software, Net | 1,622 | 1,659 | |
| Other Identifiable Intangible Assets, Net | 7,890 | 8,134 | |
| Goodwill | 16,871 | 16,251 | |
| Other Financial Assets | 192 | 355 | |
| Other Non-Current Assets | 583 | 559 | |
| Deferred Tax | 90 | 50 | |
| Total Assets | $32,439 | $32,537 | |
| Liabilities and Equity | |||
| Liabilities | |||
| Current Indebtedness | $596 | $1,008 | |
| Payables, Accruals and Provisions | 2,624 | 2,612 | |
| Deferred Revenue | 1,348 | 1,222 | |
| Other Financial Liabilities | 193 | 95 | |
| Current Liabilities Excluding Liabilities
Associated with Assets Held for Sale |
4,761 | 4,937 | |
| Liabilities Associated with Assets Held for Sale | - | 35 | |
| Current Liabilities | 4,761 | 4,972 | |
| Long-Term Indebtedness | 7,470 | 6,223 | |
| Provisions and Other Non-Current Liabilities | 1,759 | 2,502 | |
| Other Financial Liabilities | 102 | 37 | |
| Deferred Tax | 1,917 | 1,305 | |
| Total Liabilities | $16,009 | $15,039 | |
| Equity | |||
| Capital | 10,347 | 10,371 | |
| Retained Earnings | 7,303 | 8,311 | |
| Accumulated Other Comprehensive Loss | (1,614) | (1,537) | |
| Total Shareholders’ Equity | 16,036 | 17,145 | |
| Non-Controlling Interests | 394 | 353 | |
| Total Equity | 16,430 | 17,498 | |
| Total Liabilities and Equity | $32,439 | $32,537 |
Financial Results
Consolidated Statement of Cash Flow
In Millions of U.S. Dollars| Twelve Months Ended December 31, | |||
| Cash Provided By (Used In): | 2013 | 2012 | |
| Operating Activities | |||
| Net Earnings | $185 | $2,042 | |
| Adjustments for: | |||
| Depreciation | 416 | 425 | |
| Amortization of Computer Software | 773 | 691 | |
| Amortization of Other Identifiable Intangible Assets | 641 | 619 | |
| Net Gains on Disposals of Businesses and Investments | (195) | (829) | |
| Deferred Tax | 434 | (149) | |
| Other | 289 | 18 | |
| Pension contributions | (500) | - | |
| Changes in Working Capital and Other Items | 60 | (159) | |
| Net Cash Provided by Operating Activities | 2,103 | 2,658 | |
| Investing Activities | |||
| Acquisitions, Net of Cash Acquired | (1,241) | (1,301) | |
| Proceeds from Other Disposals, Net of Taxes Paid | 550 | 1,901 | |
| Capital Expenditures, Less Proceeds from Disposals | (1,004) | (964) | |
| Other Investing Activities | 67 | 46 | |
| Investing Cash Flows from Continuing Operations | (1,628) | (318) | |
| Investing Cash Flows from Discontinued Operations | 6 | 90 | |
| Net Cash Used in Investing Activities | (1,622) | (228) | |
| Financing Activities | |||
| Proceeds from Debt | 3,268 | - | |
| Repayments of Debt | (2,240) | (2) | |
| Net Repayments Under Short-Term Loan Facilities | (3) | (422) | |
| Repurchases of Common Shares | (400) | (168) | |
| Dividends Paid on Preference Shares | (3) | (3) | |
| Dividends Paid on Common Shares | (1,038) | (1,021) | |
| Other Financing Activities | (19) | 65 | |
| Net Cash Used in Financing Activities | (435) | (1,551) | |
| Translation Adjustments on Cash and Cash Equivalents | (13) | - | |
| Increase in Cash and Cash Equivalents | 33 | 879 | |
| Cash and Cash Equivalents at Beginning of Period | 1,283 | 404 | |
| Cash and Cash Equivalents at End of Period | $1,316 | $1,283 | |
| Interest paid | (414) | (419) | |
| Interest received | 9 | 5 | |
| Income taxes paid: | |||
| Within operating activities | (236) | (249) | |
| Within investing activities | (98) | (197) | |
| Total income taxes paid | (334) | (446) | |
Dividend History
Dividend History 2000-2014
Source: 2013 Earnings Presentation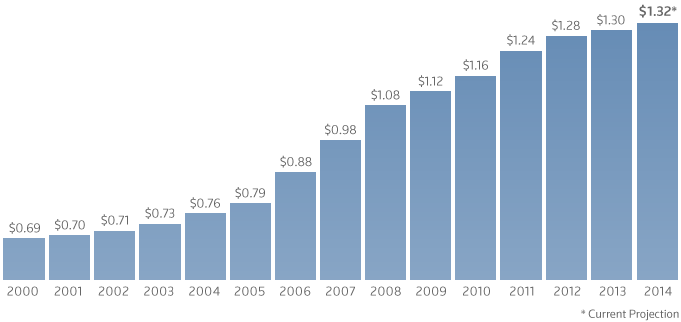
Reconciliations
Reconciliation of Operating Profit to Underlying Operating Profit (5) and Adjusted EBITDA (4)
In Millions of U.S. Dollars (Unaudited)| Twelve Months Ended December 31, | |||
| 2013 | 2012 (1) | ||
| Operating Profit | $1,516 | $2,570 | |
| Adjustments to Remove: | |||
| Amortization of Other Identifiable Intangible Assets | 641 | 619 | |
| Fair Value Adjustments | (14) | 36 | |
| Other Operating Gains, Net | (198) | (883) | |
| Operating Profit from Other Businesses (3) | (64) | (137) | |
| Underlying Operating Profit (5) | $1,881 | $2,205 | |
| Adjustments to Remove: | |||
| Depreciation and Amortization of Computer Software
(Excluding Other Businesses (3)) |
1,189 | 1,105 | |
| Adjusted EBITDA (4) | $3,070 | $3,310 | |
| Underlying Operating Profit Margin | 15.0% | 17.7% | |
| Adjusted EBITDA Margin | 24.5% | 26.6% | |
Reconciliations
Reconciliation of Earnings from Continuing Operations to Adjusted EBITDA (4)
In Millions of U.S. Dollars (Unaudited)| Twelve Months Ended December 31, | |||
| 2013 | 2012 (1) | ||
| Earnings from Continuing Operations | $175 | $2,040 | |
| Adjustments to Remove: | |||
| Tax Expense | 848 | 126 | |
| Other Finance (Income) Costs | 53 | (40) | |
| Net Interest Expense | 460 | 453 | |
| Amortization of Other Identifiable Intangible Assets | 641 | 619 | |
| Amortization of Computer Software | 773 | 691 | |
| Depreciation | 416 | 425 | |
| EBITDA | 3,366 | 4,314 | |
| Adjustments to Remove: | |||
| Share of Post-Tax Earnings and Impairment in Equity Method Investees | (20) | (9) | |
| Other Operating Gains, Net | (198) | (883) | |
| Fair Value Adjustments | (14) | 36 | |
| EBITDA from Other Businesses (3) | (64) | (148) | |
| Adjusted EBITDA (4) | $3,070 | $3,310 | |
Reconciliations
Reconciliation of Underlying Operating Profit (5) to Adjusted EBITDA (4) by Business Segment
In Millions of U.S. Dollars (Unaudited)| Twelve Months Ended December 31, 2013 |
Twelve Months Ended December 31, 2012 (1) |
|||||
| Underlying Operating Profit | Add: Depreciation and Amortization of Computer Software* | Adjusted EBITDA | Underlying Operating Profit | Add: Depreciation and Amortization of Computer Software* | Adjusted EBITDA | |
| Financial & Risk | $816 | $641 | $1,457 | $1,082 | $609 | $1,691 |
| Legal | 903 | 291 | 1,194 | 967 | 279 | 1,246 |
| Tax & Accounting | 257 | 121 | 378 | 238 | 114 | 352 |
| Intellectual Property & Science | 225 | 79 | 304 | 235 | 68 | 303 |
| Corporate & Other (includes Media) | (320) | 57 | (263) | (317) | 35 | (282) |
| $1,881 | $1,189 | $3,070 | $2,205 | $1,105 | $3,310 | |
| *Excludes Other Businesses (3) | ||||||
Reconciliations
Reconciliation of Net Cash Provided by Operating Activities to Free Cash Flow from Ongoing Businesses (7)
In Millions of U.S. Dollars (Unaudited)| Twelve Months Ended December 31, | |||
| 2013 | 2012 (1) | ||
| Net Cash Provided by Operating Activities | $2,103 | $2,658 | |
| Capital Expenditures, Less Proceeds from Disposals | (1,004) | (964) | |
| Other Investing Activities | 67 | 46 | |
| Dividends Paid on Preference Shares | (3) | (3) | |
| Free Cash Flow | 1,163 | 1,737 | |
| Remove: Other Businesses (3) | (65) | (221) | |
| Free Cash Flow from Ongoing Businesses (1) | $1,098 | $1,516 | |