- Overview
- Financial Results

- Non-IFRS Basis Performance Measures
- Cash Flow
- Revenue Profile
- Business Segment Revenue
- Business Segment Adjusted EBITDA
- Business Segment Underlying Operating Profit
- Business Segment Adjusted EBITDA and Adjusted EBITDA less Capital Expenditures
- Consolidated Income Statement
- Consolidated Statement of Financial Position
- Consolidated Statement of Cash Flow
- Dividend History
- Reconciliations

- Reconciliation of Operating Profit (Loss) to Underlying Operating Profit and Adjusted EBITDA
- Reconciliation of Earnings (Loss) from Continuing Operations to Adjusted EBITDA
- Reconciliation of Underlying Operating Profit to Adjusted EBITDA by Business Segment
- Reconciliation of Earnings (Loss) Attributable to Common Shareholders to Adjusted Earnings
- Reconciliation of Net Cash Provided by Operating Activities to Free Cash Flow from Ongoing Businesses
-
NON-IFRS BASIS PERFORMANCE MEASURES
In Millions of U.S. Dollars (Unaudited)Revenues from Ongoing Businesses

Adjusted EBITDA

Adjusted EBITDA Margin %

Adjusted EBITDA Less Capital Expenditures

Adjusted EBITDA Less Capital Expenditures Margin %
 U.S. Dollars Per Share (Unaudited)
Underlying Operating Profit

Underlying Operating Profit Margin %

Adjusted Earnings Per Share
 Close
CloseDisclaimer
Summary Financial Information
- This document includes summary financial information and should not be considered a substitute for our full financial statements, including footnotes, management/auditors’ reports, and related management’s discussion and analysis (MD&A). You can access our 2012 audited financial statements, MD&A and other annual disclosures in the “Investor Relations” section of our website, www.thomsonreuters.com, as well as in our filings with the Canadian securities regulatory authorities and the U.S. Securities and Exchange Commission.
Non-IFRS Financial Measures
- We also use certain non-IFRS financial measures. These measures include revenues from ongoing businesses, adjusted EBITDA and the related margin, adjusted EBITDA less capital expenditures, underlying operating profit and the related margin, free cash flow, free cash flow from ongoing businesses and adjusted EPS. Non-IFRS financial measures are defined and reconciled to the most directly comparable IFRS measures in this annual report and our 2012 annual MD&A. We use these non-IFRS financial measures as supplemental indicators of our operating performance and financial position. These measures do not have any standardized meaning prescribed by IFRS and therefore are unlikely to be comparable to the calculation of similar measures used by other companies, and should not be viewed as alternatives to measures of financial performance calculated in accordance with IFRS.
-
CASH FLOW
In Millions of U.S. Dollars (Unaudited)2011

2012

 Close
CloseDisclaimer
Summary Financial Information
- This document includes summary financial information and should not be considered a substitute for our full financial statements, including footnotes, management/auditors’ reports, and related management’s discussion and analysis (MD&A). You can access our 2012 audited financial statements, MD&A and other annual disclosures in the “Investor Relations” section of our website, www.thomsonreuters.com, as well as in our filings with the Canadian securities regulatory authorities and the U.S. Securities and Exchange Commission.
Non-IFRS Financial Measures
- We also use certain non-IFRS financial measures. These measures include revenues from ongoing businesses, adjusted EBITDA and the related margin, adjusted EBITDA less capital expenditures, underlying operating profit and the related margin, free cash flow, free cash flow from ongoing businesses and adjusted EPS. Non-IFRS financial measures are defined and reconciled to the most directly comparable IFRS measures in this annual report and our 2012 annual MD&A. We use these non-IFRS financial measures as supplemental indicators of our operating performance and financial position. These measures do not have any standardized meaning prescribed by IFRS and therefore are unlikely to be comparable to the calculation of similar measures used by other companies, and should not be viewed as alternatives to measures of financial performance calculated in accordance with IFRS.
-
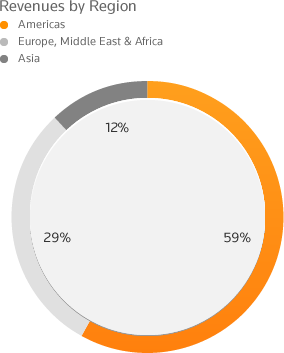
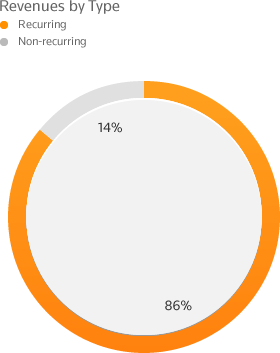
REVENUE PROFILE
(Unaudited)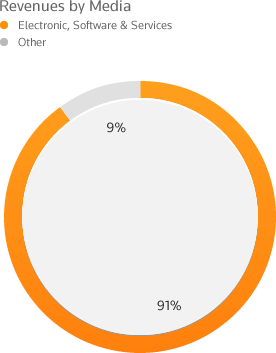
 Close
CloseDisclaimer
Summary Financial Information
- This document includes summary financial information and should not be considered a substitute for our full financial statements, including footnotes, management/auditors’ reports, and related management’s discussion and analysis (MD&A). You can access our 2012 audited financial statements, MD&A and other annual disclosures in the “Investor Relations” section of our website, www.thomsonreuters.com, as well as in our filings with the Canadian securities regulatory authorities and the U.S. Securities and Exchange Commission.
Non-IFRS Financial Measures
- We also use certain non-IFRS financial measures. These measures include revenues from ongoing businesses, adjusted EBITDA and the related margin, adjusted EBITDA less capital expenditures, underlying operating profit and the related margin, free cash flow, free cash flow from ongoing businesses and adjusted EPS. Non-IFRS financial measures are defined and reconciled to the most directly comparable IFRS measures in this annual report and our 2012 annual MD&A. We use these non-IFRS financial measures as supplemental indicators of our operating performance and financial position. These measures do not have any standardized meaning prescribed by IFRS and therefore are unlikely to be comparable to the calculation of similar measures used by other companies, and should not be viewed as alternatives to measures of financial performance calculated in accordance with IFRS.
-
BUSINESS SEGMENT REVENUE
In Millions of U.S. Dollars (Unaudited)Twelve Months Ended December 31, Revenues 2012 2011 (1) Change Organic Trading $ 3,345 $ 3,537 -5% -3% Investors 2,416 2,472 -2% -2% Marketplaces 1,213 1,134 7% 1% Governance, Risk & Compliance 219 154 42% 17% Financial & Risk 7,193 7,297 -1% -1% Legal 3,286 3,221 2% 1% Tax & Accounting 1,206 1,050 15% 5% Intellectual Property & Science 894 852 5% 3% Corporate & Other (includes Media) 331 336 -1% 1% Eliminations (11) (13) Revenues from Ongoing Businesses (2)
Before Currency12,899 12,743 1%
3%0% Other Businesses (3) 379 1,064 Revenues $ 13,278 $ 13,807 -4% CloseFootnotes
1Prior-period amounts have been reclassified to reflect the current presentation.
2Revenues from ongoing businesses are revenues from reportable segments and Corporate & Other (which includes the Media business) less eliminations. Other businesses (see note (3) below) are excluded. To facilitate comparison of actual results to the 2012 business outlook, ongoing businesses include the Financial & Risk segment's Investor Relations, Public Relations and Multimedia businesses (Corporate Services), which were announced for sale in December 2012.
3Other businesses are businesses that have been or are expected to be exited through sale or closure that did not qualify for discontinued operations classification, except for Corporate Services (see note (2) above).
Twelve Months Ended
December 31,(Millions of U.S. dollars) 2012 2011 Other Businesses Revenues $ 379 $1,064 Operating Profit 18 238 Depreciation and Amortization of Computer Software 5 55 EBITDA 23 293 Capital Expenditures Less Proceeds from Disposals $ 15 $ 75 4Thomson Reuters defines adjusted EBITDA as underlying operating profit excluding the related depreciation and amortization of computer software but including integration programs expenses. Adjusted EBITDA margin is adjusted EBITDA expressed as a percentage of revenues from ongoing businesses. Capital expenditures less proceeds from disposals (excluding Other businesses (see note (3) above) are also removed to arrive at adjusted EBITDA less capital expenditures.
5Underlying operating profit is operating profit from reportable segments and Corporate & Other (includes Media). Underlying operating profit margin is the underlying operating profit expressed as a percentage of revenues from ongoing businesses.
6Adjusted earnings and adjusted earnings per share include dividends declared on preference shares and integration programs expenses, but exclude the pre-tax impacts of amortization of other identifiable intangible assets as well as the post-tax impacts of fair value adjustments, other operating (gains) and losses, certain impairment charges, the results of Other businesses (see note (3) above), other finance (income) costs, Thomson Reuters’ share of post-tax earnings and impairment in equity method investees, discontinued operations and other items affecting comparability. Adjusted earnings per share is calculated using diluted weighted average shares and does not represent actual earnings or loss per share attributable to shareholders.
7Free cash flow is net cash provided by operating activities less capital expenditures, other investing activities and dividends paid on the company's preference shares. Other businesses (see note (3) above) are also removed to arrive at free cash flow from ongoing businesses.
CloseDisclaimer
Summary Financial Information
- This document includes summary financial information and should not be considered a substitute for our full financial statements, including footnotes, management/auditors’ reports, and related management’s discussion and analysis (MD&A). You can access our 2012 audited financial statements, MD&A and other annual disclosures in the “Investor Relations” section of our website, www.thomsonreuters.com, as well as in our filings with the Canadian securities regulatory authorities and the U.S. Securities and Exchange Commission.
Non-IFRS Financial Measures
- We also use certain non-IFRS financial measures. These measures include revenues from ongoing businesses, adjusted EBITDA and the related margin, adjusted EBITDA less capital expenditures, underlying operating profit and the related margin, free cash flow, free cash flow from ongoing businesses and adjusted EPS. Non-IFRS financial measures are defined and reconciled to the most directly comparable IFRS measures in this annual report and our 2012 annual MD&A. We use these non-IFRS financial measures as supplemental indicators of our operating performance and financial position. These measures do not have any standardized meaning prescribed by IFRS and therefore are unlikely to be comparable to the calculation of similar measures used by other companies, and should not be viewed as alternatives to measures of financial performance calculated in accordance with IFRS.
-
Business Segment Adjusted EBITDA (4)
In Millions of U.S. Dollars (Unaudited)Twelve Months Ended December 31, Adjusted EBITDA 2012 2011 (1) Change Financial & Risk $ 1,842 $ 1,972 -7% Legal 1,243 1,210 3% Tax & Accounting 376 332 13% Intellectual Property & Science 303 296 2% Corporate & Other (includes Media) (235) (227) Integration programs expenses - (215) Adjusted EBITDA $ 3,529 $ 3,368 5% CloseFootnotes
1Prior-period amounts have been reclassified to reflect the current presentation.
2Revenues from ongoing businesses are revenues from reportable segments and Corporate & Other (which includes the Media business) less eliminations. Other businesses (see note (3) below) are excluded. To facilitate comparison of actual results to the 2012 business outlook, ongoing businesses include the Financial & Risk segment's Investor Relations, Public Relations and Multimedia businesses (Corporate Services), which were announced for sale in December 2012.
3Other businesses are businesses that have been or are expected to be exited through sale or closure that did not qualify for discontinued operations classification, except for Corporate Services (see note (2) above).
Twelve Months Ended
December 31,(Millions of U.S. dollars) 2012 2011 Other Businesses Revenues $ 379 $1,064 Operating Profit 18 238 Depreciation and Amortization of Computer Software 5 55 EBITDA 23 293 Capital Expenditures Less Proceeds from Disposals $ 15 $ 75 4Thomson Reuters defines adjusted EBITDA as underlying operating profit excluding the related depreciation and amortization of computer software but including integration programs expenses. Adjusted EBITDA margin is adjusted EBITDA expressed as a percentage of revenues from ongoing businesses. Capital expenditures less proceeds from disposals (excluding Other businesses (see note (3) above) are also removed to arrive at adjusted EBITDA less capital expenditures.
5Underlying operating profit is operating profit from reportable segments and Corporate & Other (includes Media). Underlying operating profit margin is the underlying operating profit expressed as a percentage of revenues from ongoing businesses.
6Adjusted earnings and adjusted earnings per share include dividends declared on preference shares and integration programs expenses, but exclude the pre-tax impacts of amortization of other identifiable intangible assets as well as the post-tax impacts of fair value adjustments, other operating (gains) and losses, certain impairment charges, the results of Other businesses (see note (3) above), other finance (income) costs, Thomson Reuters’ share of post-tax earnings and impairment in equity method investees, discontinued operations and other items affecting comparability. Adjusted earnings per share is calculated using diluted weighted average shares and does not represent actual earnings or loss per share attributable to shareholders.
7Free cash flow is net cash provided by operating activities less capital expenditures, other investing activities and dividends paid on the company's preference shares. Other businesses (see note (3) above) are also removed to arrive at free cash flow from ongoing businesses.
CloseDisclaimer
Summary Financial Information
- This document includes summary financial information and should not be considered a substitute for our full financial statements, including footnotes, management/auditors’ reports, and related management’s discussion and analysis (MD&A). You can access our 2012 audited financial statements, MD&A and other annual disclosures in the “Investor Relations” section of our website, www.thomsonreuters.com, as well as in our filings with the Canadian securities regulatory authorities and the U.S. Securities and Exchange Commission.
Non-IFRS Financial Measures
- We also use certain non-IFRS financial measures. These measures include revenues from ongoing businesses, adjusted EBITDA and the related margin, adjusted EBITDA less capital expenditures, underlying operating profit and the related margin, free cash flow, free cash flow from ongoing businesses and adjusted EPS. Non-IFRS financial measures are defined and reconciled to the most directly comparable IFRS measures in this annual report and our 2012 annual MD&A. We use these non-IFRS financial measures as supplemental indicators of our operating performance and financial position. These measures do not have any standardized meaning prescribed by IFRS and therefore are unlikely to be comparable to the calculation of similar measures used by other companies, and should not be viewed as alternatives to measures of financial performance calculated in accordance with IFRS.
-
Business Segment Underlying Operating Profit (5)
In Millions of U.S. Dollars (Unaudited)Twelve Months Ended December 31, Underlying Operating Profit 2012 2011 (1) Change Financial & Risk $ 1,215 $ 1,396 -13% Legal 964 941 2% Tax & Accounting 261 237 10% Intellectual Property & Science 235 237 -1% Corporate & Other (includes Media) (270) (270) Underlying Operating Profit $ 2,405 $ 2,541 -5% CloseFootnotes
1Prior-period amounts have been reclassified to reflect the current presentation.
2Revenues from ongoing businesses are revenues from reportable segments and Corporate & Other (which includes the Media business) less eliminations. Other businesses (see note (3) below) are excluded. To facilitate comparison of actual results to the 2012 business outlook, ongoing businesses include the Financial & Risk segment's Investor Relations, Public Relations and Multimedia businesses (Corporate Services), which were announced for sale in December 2012.
3Other businesses are businesses that have been or are expected to be exited through sale or closure that did not qualify for discontinued operations classification, except for Corporate Services (see note (2) above).
Twelve Months Ended
December 31,(Millions of U.S. dollars) 2012 2011 Other Businesses Revenues $ 379 $1,064 Operating Profit 18 238 Depreciation and Amortization of Computer Software 5 55 EBITDA 23 293 Capital Expenditures Less Proceeds from Disposals $ 15 $ 75 4Thomson Reuters defines adjusted EBITDA as underlying operating profit excluding the related depreciation and amortization of computer software but including integration programs expenses. Adjusted EBITDA margin is adjusted EBITDA expressed as a percentage of revenues from ongoing businesses. Capital expenditures less proceeds from disposals (excluding Other businesses (see note (3) above) are also removed to arrive at adjusted EBITDA less capital expenditures.
5Underlying operating profit is operating profit from reportable segments and Corporate & Other (includes Media). Underlying operating profit margin is the underlying operating profit expressed as a percentage of revenues from ongoing businesses.
6Adjusted earnings and adjusted earnings per share include dividends declared on preference shares and integration programs expenses, but exclude the pre-tax impacts of amortization of other identifiable intangible assets as well as the post-tax impacts of fair value adjustments, other operating (gains) and losses, certain impairment charges, the results of Other businesses (see note (3) above), other finance (income) costs, Thomson Reuters’ share of post-tax earnings and impairment in equity method investees, discontinued operations and other items affecting comparability. Adjusted earnings per share is calculated using diluted weighted average shares and does not represent actual earnings or loss per share attributable to shareholders.
7Free cash flow is net cash provided by operating activities less capital expenditures, other investing activities and dividends paid on the company's preference shares. Other businesses (see note (3) above) are also removed to arrive at free cash flow from ongoing businesses.
CloseDisclaimer
Summary Financial Information
- This document includes summary financial information and should not be considered a substitute for our full financial statements, including footnotes, management/auditors’ reports, and related management’s discussion and analysis (MD&A). You can access our 2012 audited financial statements, MD&A and other annual disclosures in the “Investor Relations” section of our website, www.thomsonreuters.com, as well as in our filings with the Canadian securities regulatory authorities and the U.S. Securities and Exchange Commission.
Non-IFRS Financial Measures
- We also use certain non-IFRS financial measures. These measures include revenues from ongoing businesses, adjusted EBITDA and the related margin, adjusted EBITDA less capital expenditures, underlying operating profit and the related margin, free cash flow, free cash flow from ongoing businesses and adjusted EPS. Non-IFRS financial measures are defined and reconciled to the most directly comparable IFRS measures in this annual report and our 2012 annual MD&A. We use these non-IFRS financial measures as supplemental indicators of our operating performance and financial position. These measures do not have any standardized meaning prescribed by IFRS and therefore are unlikely to be comparable to the calculation of similar measures used by other companies, and should not be viewed as alternatives to measures of financial performance calculated in accordance with IFRS.
-
Business Segment Adjusted EBITDA (4) and Adjusted EBITDA less Capital Expenditures
In Millions of U.S. Dollars (Unaudited)Twelve Months Ended December 31, Adjusted EBITDA 2012 2011 (1) Change Financial & Risk $ 1,842 $ 1,972 -7% Legal 1,243 1,210 3% Tax & Accounting 376 332 13% Intellectual Property & Science 303 296 2% Corporate & Other (includes Media) (235) (227) Integration programs expenses - (215) Adjusted EBITDA 3,529 3,368 5% Less: Capital expenditures, less proceeds from disposals
(excluding Other businesses) (3)962 966 0% Adjusted EBITDA less capital expenditures (4) $ 2,567 $ 2,402 7% CloseFootnotes
1Prior-period amounts have been reclassified to reflect the current presentation.
2Revenues from ongoing businesses are revenues from reportable segments and Corporate & Other (which includes the Media business) less eliminations. Other businesses (see note (3) below) are excluded. To facilitate comparison of actual results to the 2012 business outlook, ongoing businesses include the Financial & Risk segment's Investor Relations, Public Relations and Multimedia businesses (Corporate Services), which were announced for sale in December 2012.
3Other businesses are businesses that have been or are expected to be exited through sale or closure that did not qualify for discontinued operations classification, except for Corporate Services (see note (2) above).
Twelve Months Ended
December 31,(Millions of U.S. dollars) 2012 2011 Other Businesses Revenues $ 379 $1,064 Operating Profit 18 238 Depreciation and Amortization of Computer Software 5 55 EBITDA 23 293 Capital Expenditures Less Proceeds from Disposals $ 15 $ 75 4Thomson Reuters defines adjusted EBITDA as underlying operating profit excluding the related depreciation and amortization of computer software but including integration programs expenses. Adjusted EBITDA margin is adjusted EBITDA expressed as a percentage of revenues from ongoing businesses. Capital expenditures less proceeds from disposals (excluding Other businesses (see note (3) above) are also removed to arrive at adjusted EBITDA less capital expenditures.
5Underlying operating profit is operating profit from reportable segments and Corporate & Other (includes Media). Underlying operating profit margin is the underlying operating profit expressed as a percentage of revenues from ongoing businesses.
6Adjusted earnings and adjusted earnings per share include dividends declared on preference shares and integration programs expenses, but exclude the pre-tax impacts of amortization of other identifiable intangible assets as well as the post-tax impacts of fair value adjustments, other operating (gains) and losses, certain impairment charges, the results of Other businesses (see note (3) above), other finance (income) costs, Thomson Reuters’ share of post-tax earnings and impairment in equity method investees, discontinued operations and other items affecting comparability. Adjusted earnings per share is calculated using diluted weighted average shares and does not represent actual earnings or loss per share attributable to shareholders.
7Free cash flow is net cash provided by operating activities less capital expenditures, other investing activities and dividends paid on the company's preference shares. Other businesses (see note (3) above) are also removed to arrive at free cash flow from ongoing businesses.
CloseDisclaimer
Summary Financial Information
- This document includes summary financial information and should not be considered a substitute for our full financial statements, including footnotes, management/auditors’ reports, and related management’s discussion and analysis (MD&A). You can access our 2012 audited financial statements, MD&A and other annual disclosures in the “Investor Relations” section of our website, www.thomsonreuters.com, as well as in our filings with the Canadian securities regulatory authorities and the U.S. Securities and Exchange Commission.
Non-IFRS Financial Measures
- We also use certain non-IFRS financial measures. These measures include revenues from ongoing businesses, adjusted EBITDA and the related margin, adjusted EBITDA less capital expenditures, underlying operating profit and the related margin, free cash flow, free cash flow from ongoing businesses and adjusted EPS. Non-IFRS financial measures are defined and reconciled to the most directly comparable IFRS measures in this annual report and our 2012 annual MD&A. We use these non-IFRS financial measures as supplemental indicators of our operating performance and financial position. These measures do not have any standardized meaning prescribed by IFRS and therefore are unlikely to be comparable to the calculation of similar measures used by other companies, and should not be viewed as alternatives to measures of financial performance calculated in accordance with IFRS.
-
CONSOLIDATED INCOME STATEMENT
In Millions of U.S. Dollars, except per share amountsTwelve Months Ended December 31, 2012 2011 Revenues $ 13,278 $ 13,807 Operating Expenses (9,762) (9,997) Depreciation (429) (438) Amortization of Computer Software (700) (659) Amortization of Other Identifiable Intangible Assets (619) (612) Goodwill Impairment - (3,010) Other Operating Gains, Net 883 204 Operating Profit (Loss) 2,651 (705) Finance Costs, Net: Net Interest Expense (390) (396) Other Finance Income (Costs) 40 (15) Income (Loss) Before Tax and Equity Method Investees 2,301 (1,116) Share of Post-Tax Earnings and Impairment in Equity Method Investees (23) 13 Tax Expense (157) (293) Earnings (Loss) from Continuing Operations 2,121 (1,396) Earnings from Discontinued Operations, Net of Tax 2 4 Net Earnings (Loss) 2,123 (1,392) Earnings (Loss) Attributable to: Common Shareholders 2,070 (1,390) Non-Controlling Interests 53 (2) Earnings (Loss) Per Share Basic Earnings (Loss) Per Share: From Continuing Operations $ 2.50 $ (1.68) From Discontinued Operations - 0.01 Basic Earnings (Loss) Per Share $ 2.50 $ (1.67) Diluted Earnings (Loss) Per Share: From Continuing Operations $ 2.49 $ (1.68) From Discontinued Operations - 0.01 Diluted Earnings (Loss) Per Share $ 2.49 $ (1.67) CloseDisclaimer
Summary Financial Information
- This document includes summary financial information and should not be considered a substitute for our full financial statements, including footnotes, management/auditors’ reports, and related management’s discussion and analysis (MD&A). You can access our 2012 audited financial statements, MD&A and other annual disclosures in the “Investor Relations” section of our website, www.thomsonreuters.com, as well as in our filings with the Canadian securities regulatory authorities and the U.S. Securities and Exchange Commission.
Non-IFRS Financial Measures
- We also use certain non-IFRS financial measures. These measures include revenues from ongoing businesses, adjusted EBITDA and the related margin, adjusted EBITDA less capital expenditures, underlying operating profit and the related margin, free cash flow, free cash flow from ongoing businesses and adjusted EPS. Non-IFRS financial measures are defined and reconciled to the most directly comparable IFRS measures in this annual report and our 2012 annual MD&A. We use these non-IFRS financial measures as supplemental indicators of our operating performance and financial position. These measures do not have any standardized meaning prescribed by IFRS and therefore are unlikely to be comparable to the calculation of similar measures used by other companies, and should not be viewed as alternatives to measures of financial performance calculated in accordance with IFRS.
-
CONSOLIDATED STATEMENT OF FINANCIAL POSITION
In Millions of U.S. DollarsTwelve Months Ended December 31, Assets 2012 2011 Cash and Cash Equivalents $ 1,301 $ 422 Trade and Other Receivables 1,835 1,984 Other Financial Assets 72 100 Prepaid Expenses and Other Current Assets 641 641 Current Assets Excluding Assets Held for Sale 3,849 3,147 Assets Held for Sale 302 767 Current Assets 4,151 3,914 Computer Hardware and Other Property, Net 1,423 1,509 Computer Software, Net 1,682 1,640 Other Identifiable Intangible Assets, Net 8,135 8,471 Goodwill 16,256 15,932 Other Financial Assets 360 425 Other Non-Current Assets 515 535 Deferred Tax 50 50 Total Assets $ 32,572 $ 32,476 Liabilities and Equity Liabilities Current Indebtedness $ 1,008 $ 434 Payables, Accruals and Provisions 2,633 2,675 Deferred Revenue 1,224 1,379 Other Financial Liabilities 95 81 Current Liabilities Excluding Liabilities
Associated with Assets Held for Sale4,960 4,569 Liabilities Associated with Assets Held for Sale 35 35 Current Liabilities 4,995 4,604 Long-Term Indebtedness 6,223 7,160 Provisions and Other Non-Current Liabilities 2,514 2,513 Other Financial Liabilities 37 27 Deferred Tax 1,305 1,422 Total Liabilities $ 15,074 $ 15,726 Equity Capital 10,371 10,288 Retained Earnings 8,311 7,633 Accumulated Other Comprehensive Loss (1,537) (1,516) Total Shareholders’ Equity 17,145 16,405 Non-Controlling Interests 353 345 Total Equity 17,498 16,750 Total Liabilities and Equity $ 32,572 $ 32,476 CloseDisclaimer
Summary Financial Information
- This document includes summary financial information and should not be considered a substitute for our full financial statements, including footnotes, management/auditors’ reports, and related management’s discussion and analysis (MD&A). You can access our 2012 audited financial statements, MD&A and other annual disclosures in the “Investor Relations” section of our website, www.thomsonreuters.com, as well as in our filings with the Canadian securities regulatory authorities and the U.S. Securities and Exchange Commission.
Non-IFRS Financial Measures
- We also use certain non-IFRS financial measures. These measures include revenues from ongoing businesses, adjusted EBITDA and the related margin, adjusted EBITDA less capital expenditures, underlying operating profit and the related margin, free cash flow, free cash flow from ongoing businesses and adjusted EPS. Non-IFRS financial measures are defined and reconciled to the most directly comparable IFRS measures in this annual report and our 2012 annual MD&A. We use these non-IFRS financial measures as supplemental indicators of our operating performance and financial position. These measures do not have any standardized meaning prescribed by IFRS and therefore are unlikely to be comparable to the calculation of similar measures used by other companies, and should not be viewed as alternatives to measures of financial performance calculated in accordance with IFRS.
-
CONSOLIDATED STATEMENT OF CASH FLOW
In Millions of U.S. DollarsTwelve Months Ended December 31, Cash Provided By (Used In): 2012 2011 Operating Activities Net Earnings (Loss) $ 2,123 $ (1,392) Adjustments for: Depreciation 429 438 Amortization of Computer Software 700 659 Amortization of Other Identifiable Intangible Assets 619 612 Goodwill Impairment - 3,010 Net Gains on Disposals of Businesses and Investments (829) (388) Deferred Tax (118) (202) Other (61) 139 Changes in Working Capital and Other Items (159) (279) Net Cash Provided by Operating Activities 2,704 2,597 Investing Activities Acquisitions, Net of Cash Acquired (1,301) (1,286) Proceeds from Other Disposals, Net of Taxes Paid 1,901 415 Capital Expenditures, Less Proceeds from Disposals (977) (1,041) Other Investing Activities 13 49 Investing Cash Flows from Continuing Operations (364) (1,863) Investing Cash Flows from Discontinued Operations 90 56 Net Cash Used in Investing Activities (274) (1,807) Financing Activities Proceeds from Debt - 349 Repayments of Debt (2) (648) Net (Repayments) Borrowings Under Short-Term Loan Facilities (422) 400 Repurchases of Common Shares (168) (326) Dividends Paid on Preference Shares (3) (3) Dividends Paid on Common Shares (1,021) (960) Other Financing Activities 65 (39) Net Cash Used in Financing Activities (1,551) (1,227) Translation Adjustments on Cash and Cash Equivalents - (5) Increase (Decrease) in Cash and Cash Equivalents 879 (442) Cash and Cash Equivalents at Beginning of Period 422 864 Cash and Cash Equivalents at End of Period $ 1,301 $ 422 CloseDisclaimer
Summary Financial Information
- This document includes summary financial information and should not be considered a substitute for our full financial statements, including footnotes, management/auditors’ reports, and related management’s discussion and analysis (MD&A). You can access our 2012 audited financial statements, MD&A and other annual disclosures in the “Investor Relations” section of our website, www.thomsonreuters.com, as well as in our filings with the Canadian securities regulatory authorities and the U.S. Securities and Exchange Commission.
Non-IFRS Financial Measures
- We also use certain non-IFRS financial measures. These measures include revenues from ongoing businesses, adjusted EBITDA and the related margin, adjusted EBITDA less capital expenditures, underlying operating profit and the related margin, free cash flow, free cash flow from ongoing businesses and adjusted EPS. Non-IFRS financial measures are defined and reconciled to the most directly comparable IFRS measures in this annual report and our 2012 annual MD&A. We use these non-IFRS financial measures as supplemental indicators of our operating performance and financial position. These measures do not have any standardized meaning prescribed by IFRS and therefore are unlikely to be comparable to the calculation of similar measures used by other companies, and should not be viewed as alternatives to measures of financial performance calculated in accordance with IFRS.

